Some visualizations.
Here are examples of figures and automated reports.
Some examples of automated reports. The code loops over each subgroup and generates a report for them.
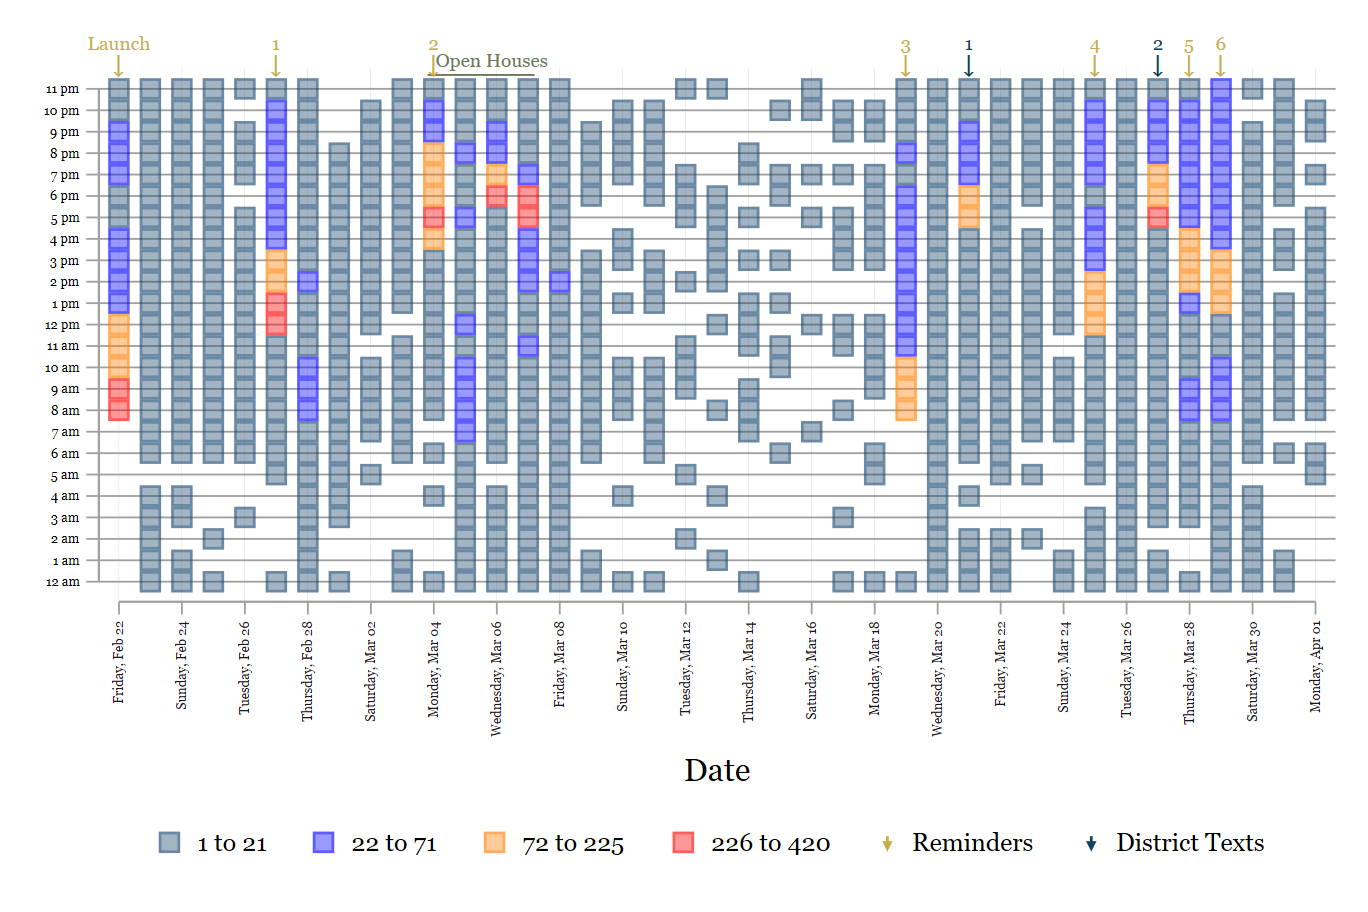
This figure shows the date and time surveys were completed hourly. It includes markers at the top, noting when reminders were sent.
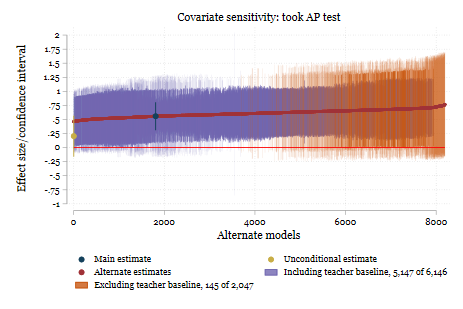
After running alternate models using each combination of potential control variables, this figure shows effect sizes with transparent lines representing models where the treatment effect was not statistically significant (the number of significant models is noted in the legend also). The different colors for models including impactful covariates.
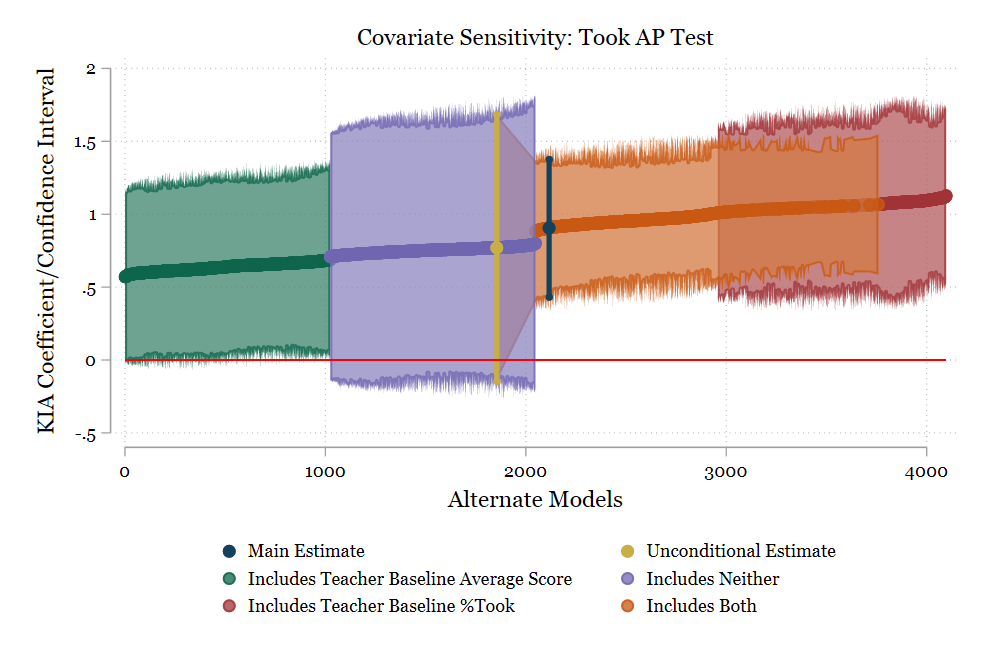
Alternative presentation of covariate sensitivity plots highlighting impactful covariates. This presentation made more sense when the effect size and confidence interval size overlapped less.
This figure shows the estimate sensitivity to the removal of teachers in the study and their matched comparison teachers.
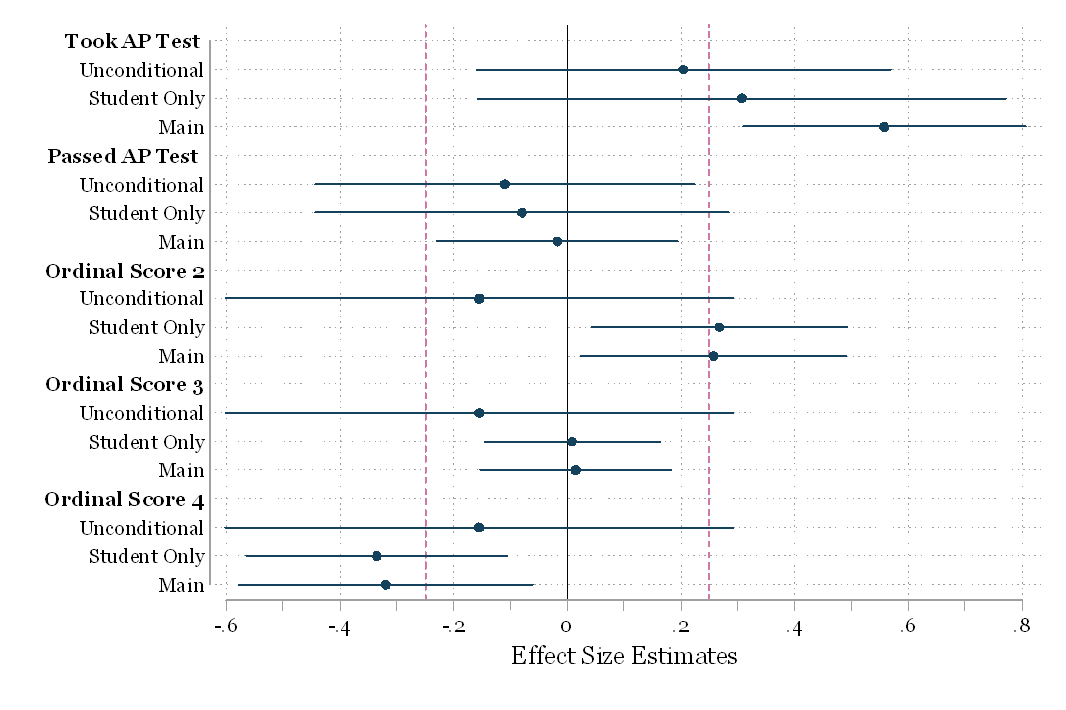
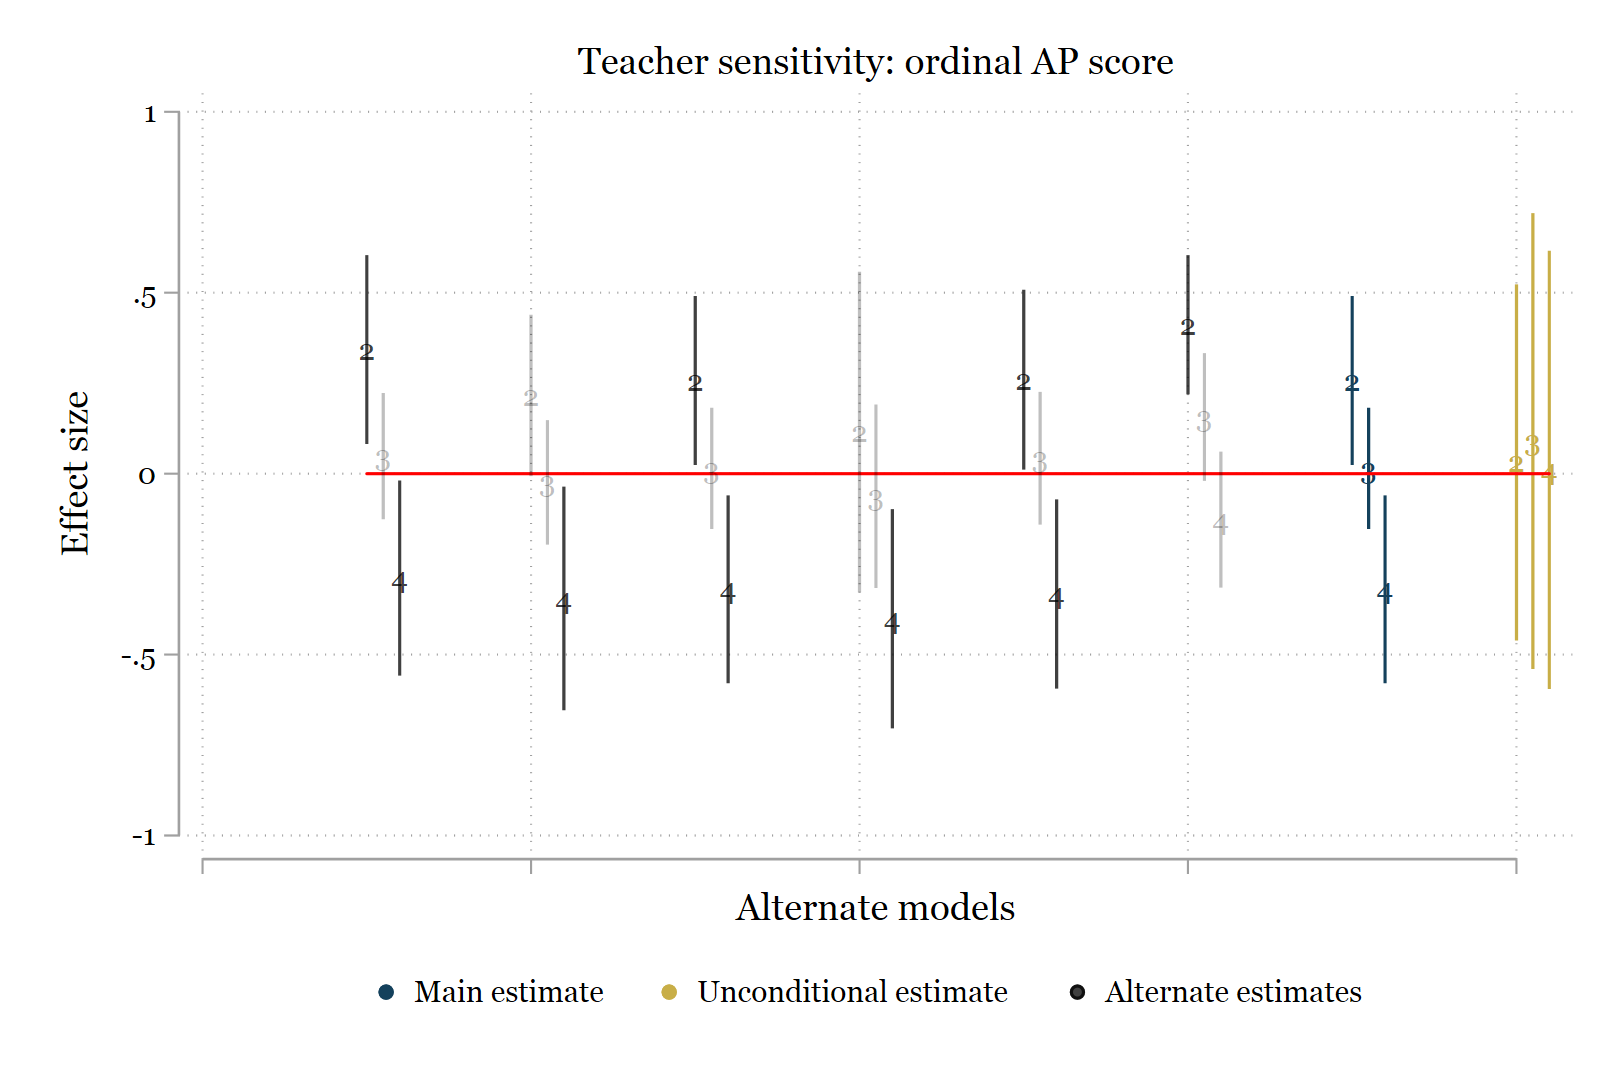
Effect size plot for a variety of specifications for three dependent variables and including vertical lines for .25 ES (What Works Clearinghouse standard for meaningful effect).
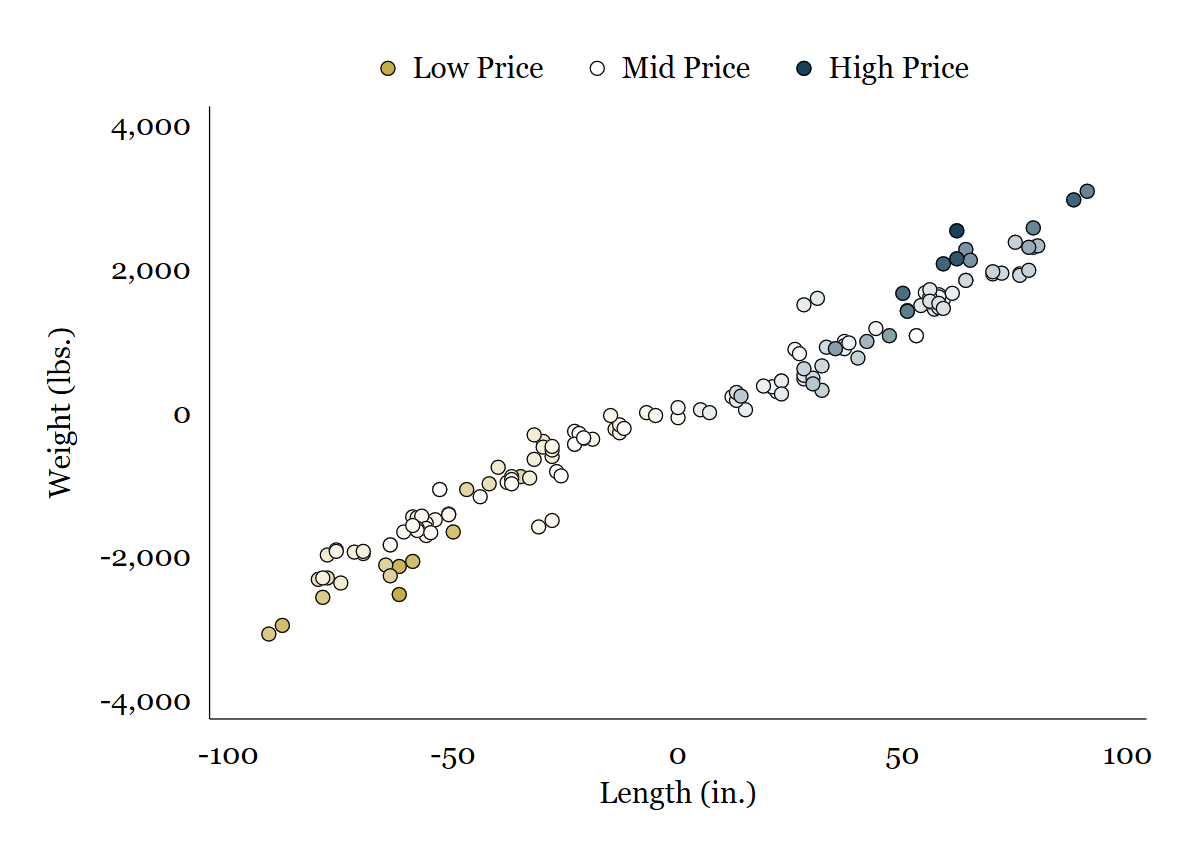
An example of a scatter plot using color to plot a third variable. Color gradations vary continuously between the colors with the variation of the values.
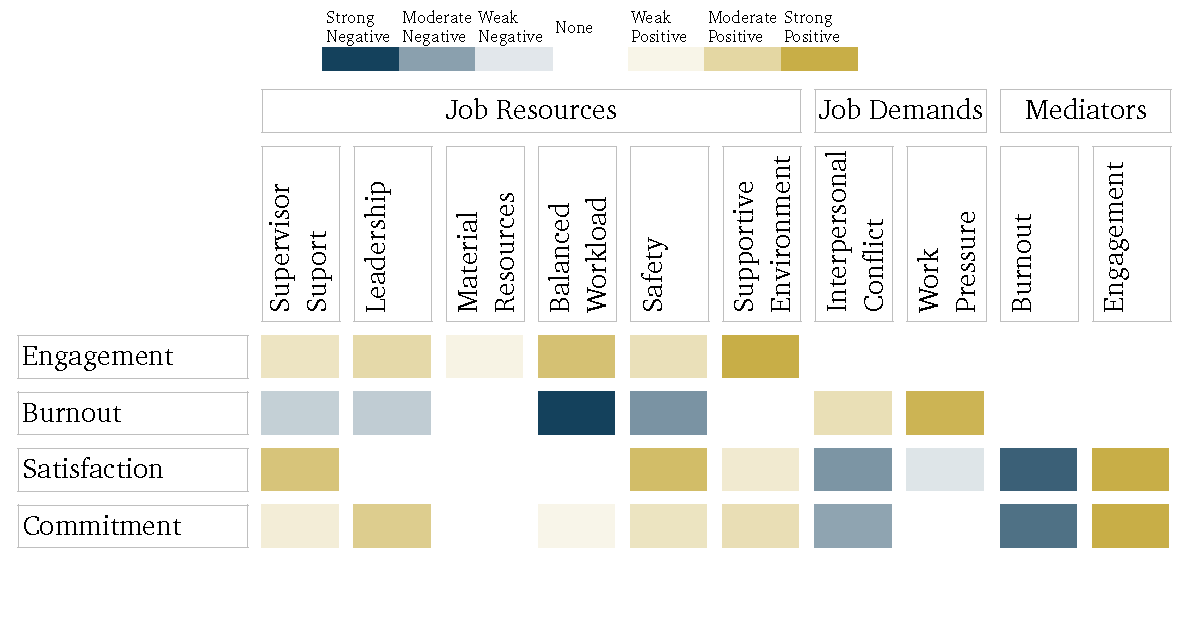
A plot (written in LaTeX) which uses colors to help interpret Structural Equation Model coefficients. Darker colors represent larger coefficients; the blue represents a negative relationship negative, and yellow is positive. Colors vary continuously with the coefficients between white and each endpoint color. Statistically insignificant effects are left white.
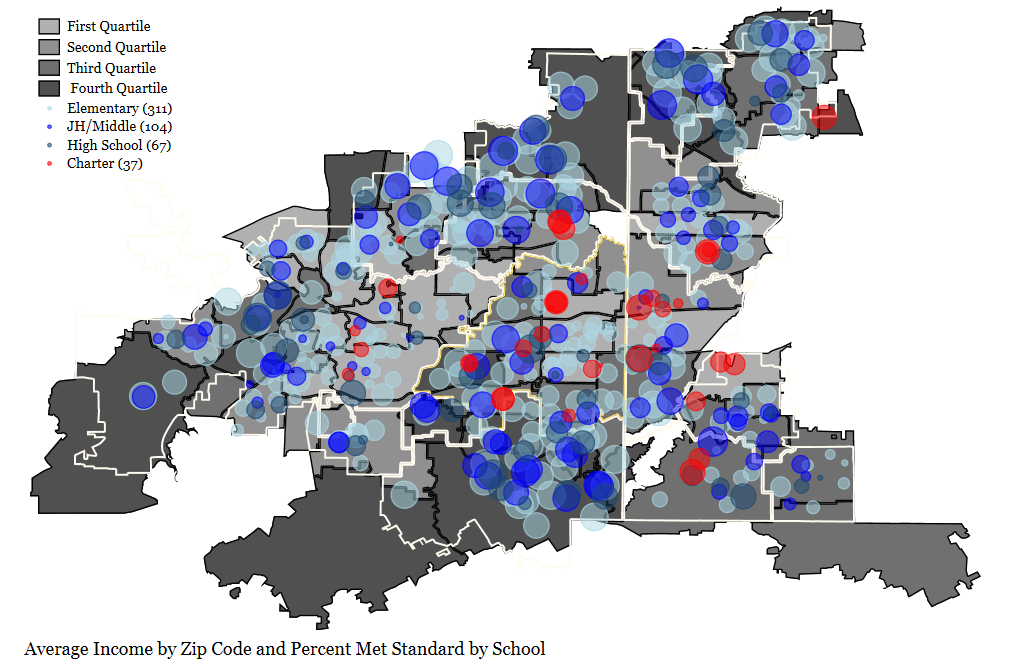
GIS map of a school district and surrounding districts. The average income is shown grayscale by zip code. The percent of students who met standards is indicated by dot size for schools, whose color represents the school level. School districts are outlined in white, except for the district of interest, which is outlined in yellow.
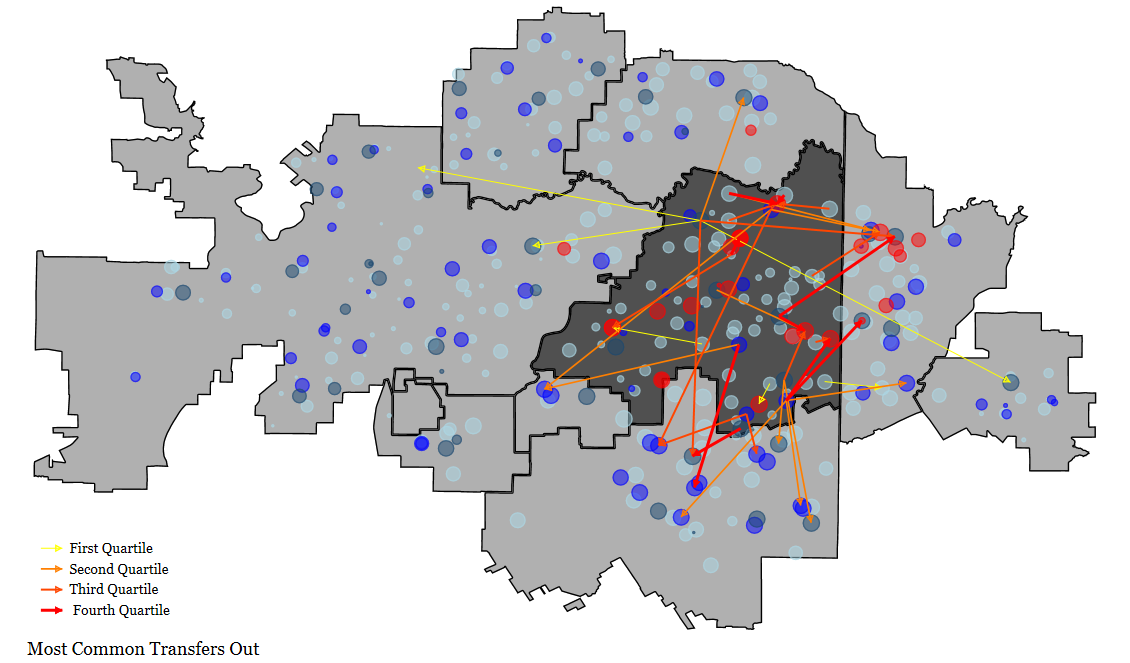
This GIS plot shows the most common transfers by school out of a school district (dark) to others. The dot colors represent school types, and the dot sizes represent the number of students transferring out (regardless of to which particular campus), which the arrows show.
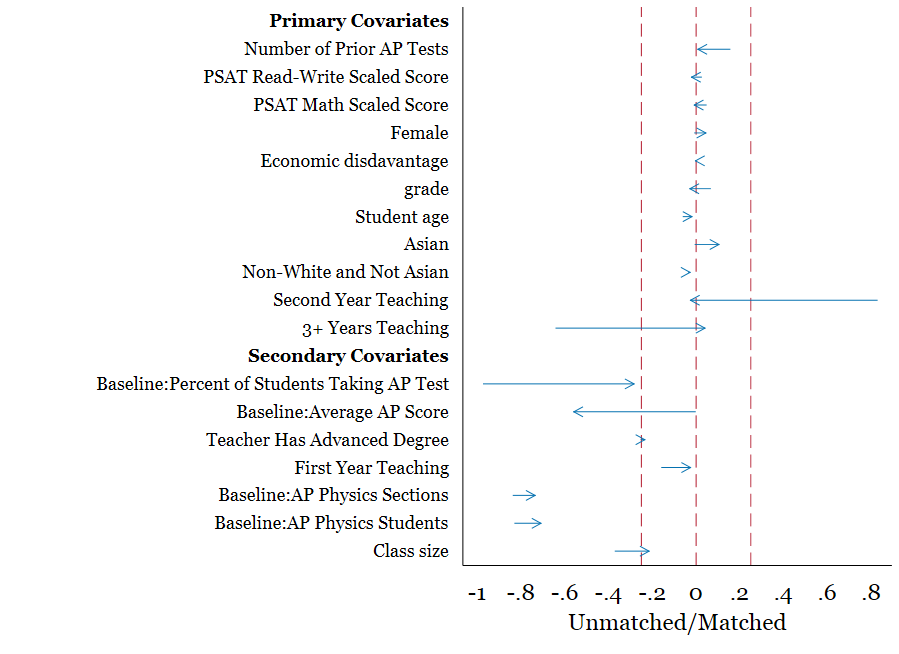
Bias reduction figure after inverse proportional weighting.
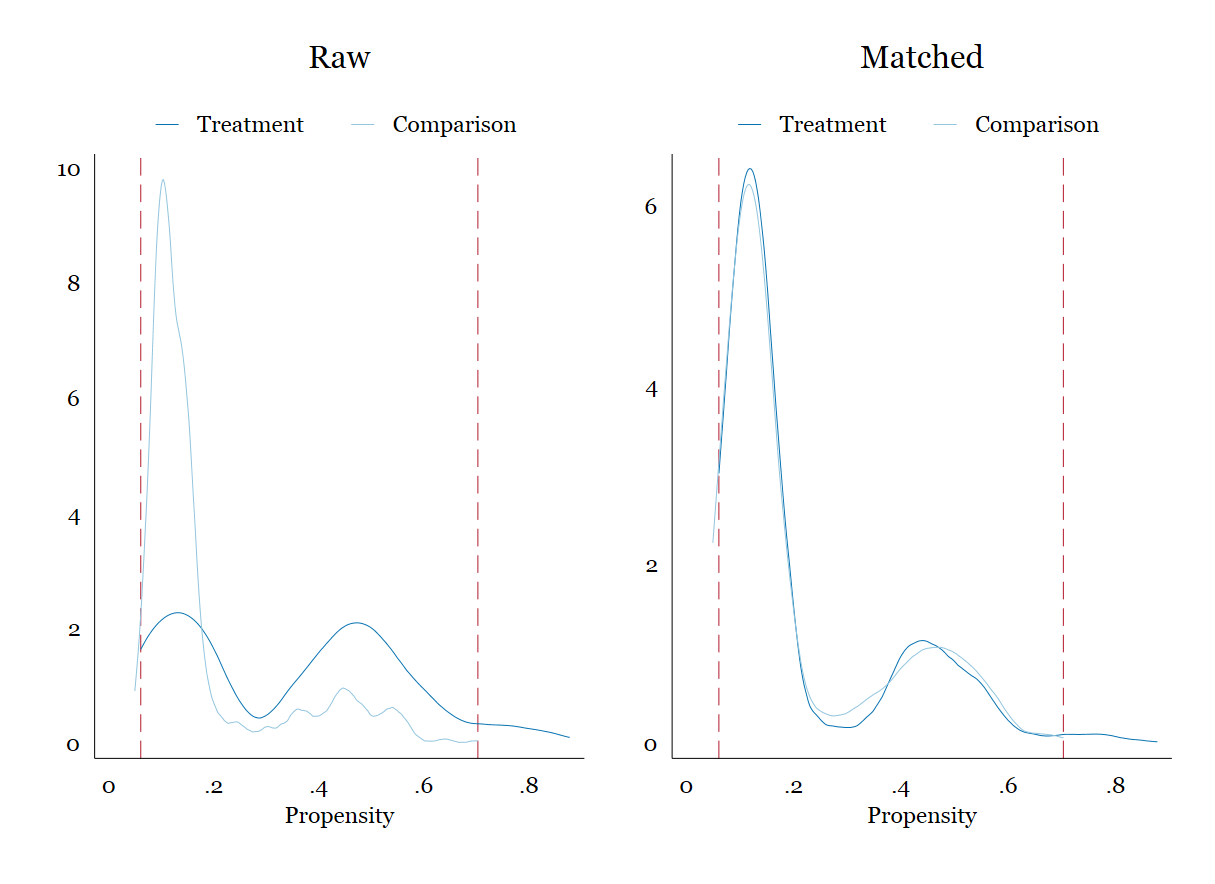
Common support and propensity score distribution.
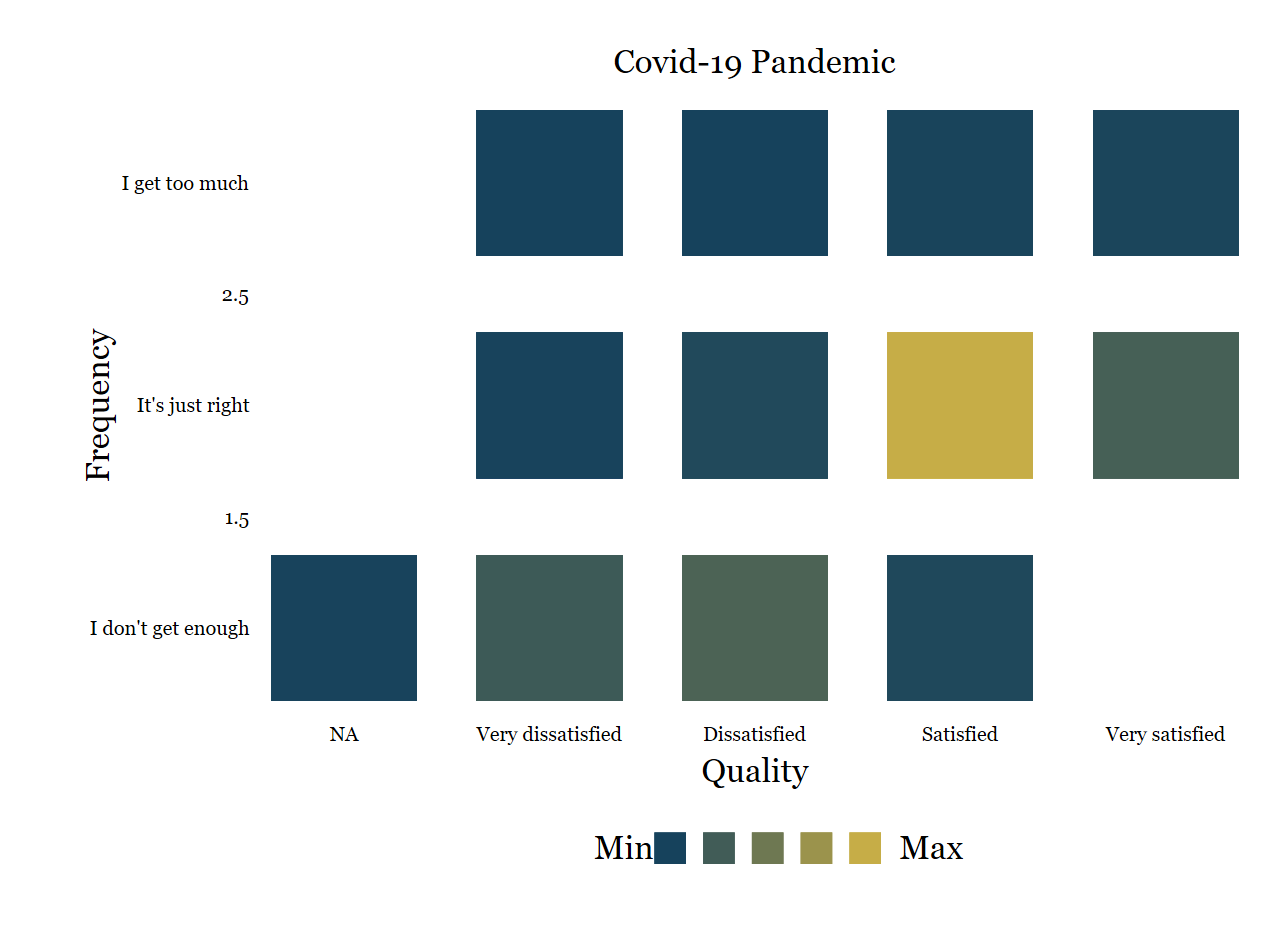
A heatmap about quality and frequency of COVID communications.
More examples of automated reports. The code loops over each school district, Education Service Center Region (into which districts are grouped), and statewide results.
This is an alternative way to present the information on page 3 of the prior example.
An example of district department reports from a survey, these also included comments made to the department (not shown).
These were reports on after school centers. The tricky part of these was that other staff wrote the qualitative portions, and do not understand LaTeX. I devised a system for them to put text into excel cells (or text files) and pull those into the reports.
